Ottawa’s Executive Cuts Need a Payroll Ledger
First Ottawa grew the executive ranks. Now it wants credit for cuts. Canadians need the payroll, bonus, severance and consultant-backfill receipts.
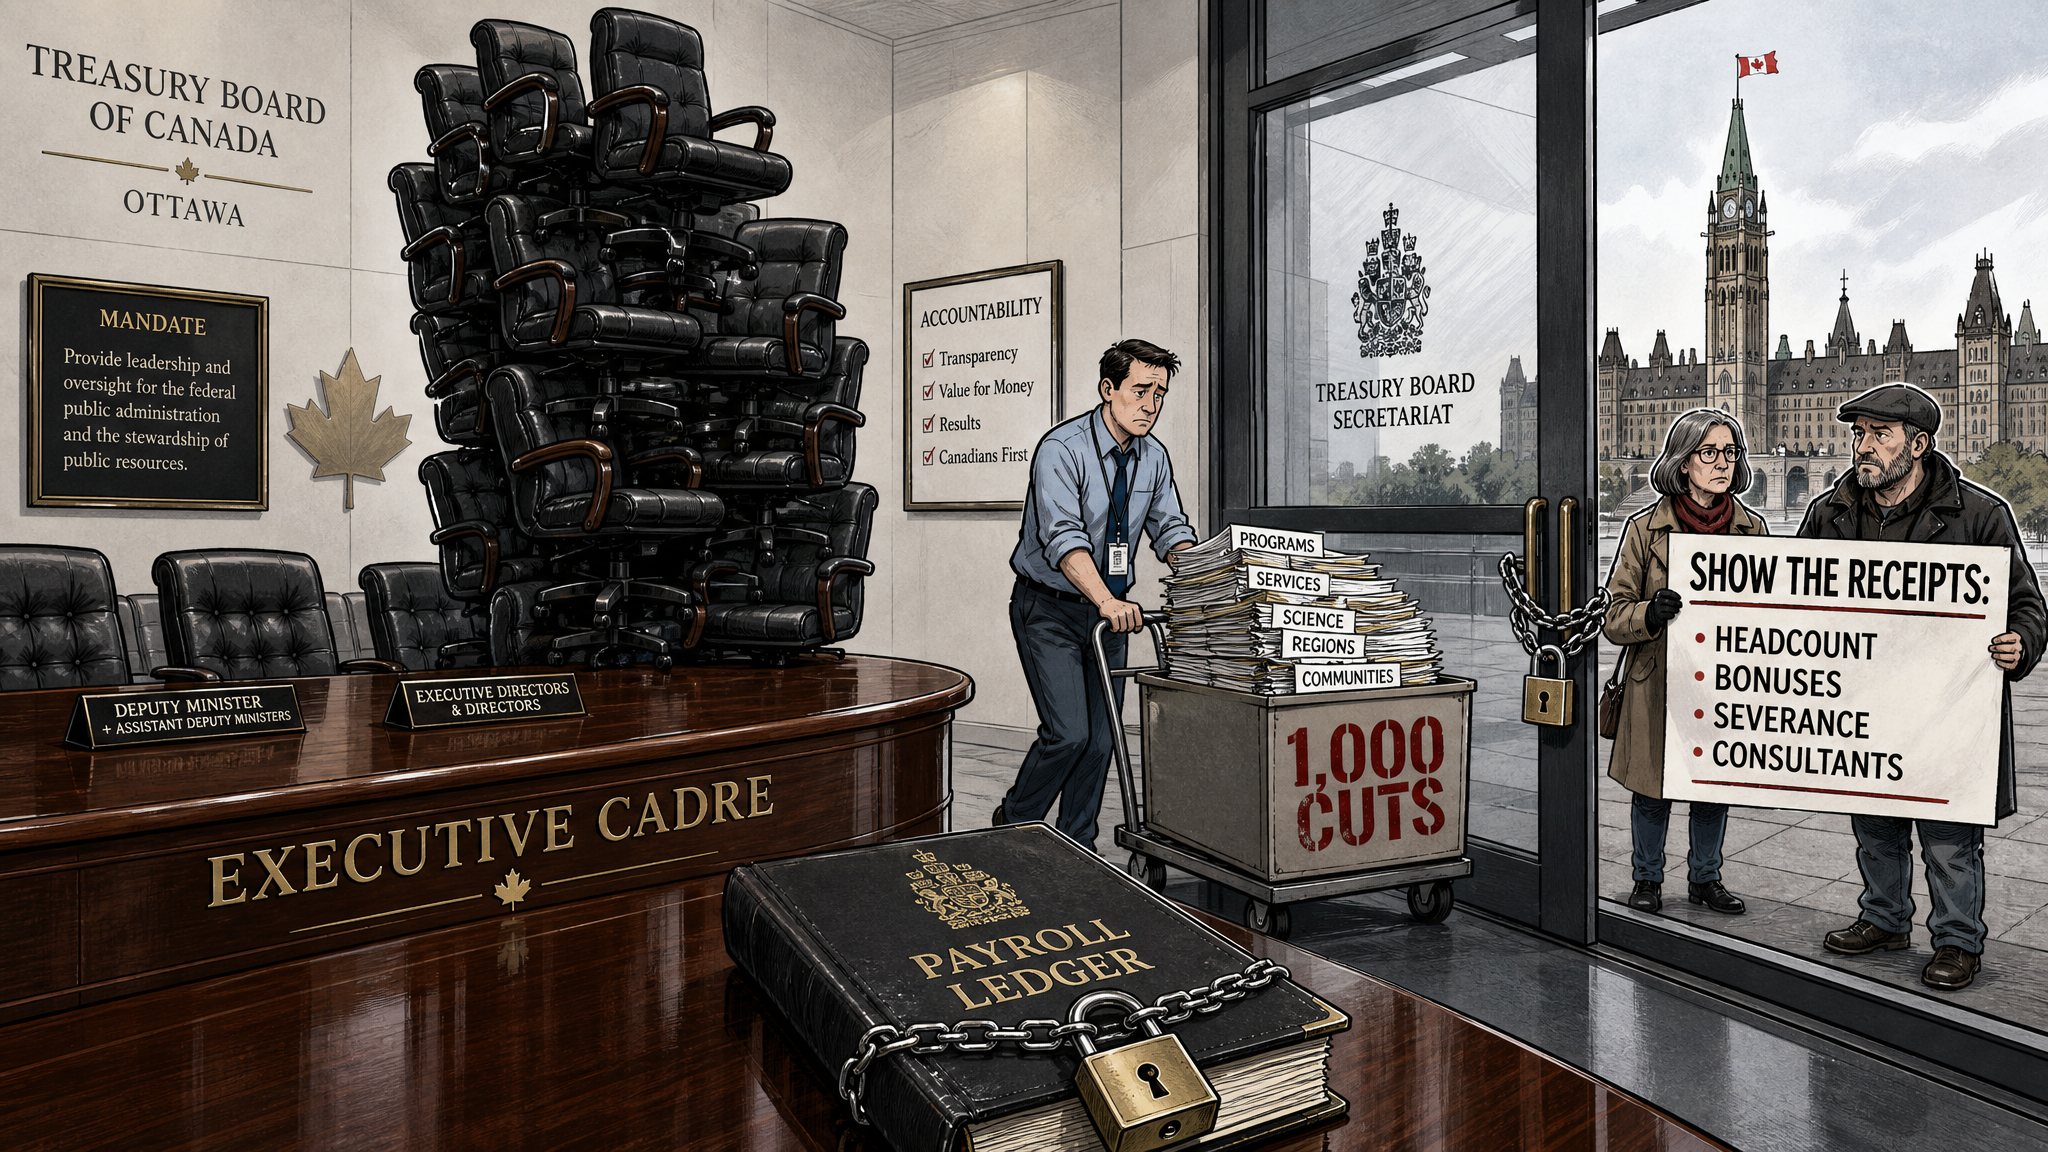
Treasury Board’s own committee binder says the federal government will reduce the executive cadre by 1,000 positions over the next two years, roughly 12 percent. It also says the broader public service is expected to fall to about 330,000 positions by the end of 2028–29, down about 40,000 from a peak of almost 368,000 in 2023–24.
That is being sold as restraint. But restraint after expansion is not the same as accountability. The public record shows the executive layer grew sharply before Ottawa discovered austerity. The March 2026 Open Government dataset lists 9,041 federal public service executives across the core public administration and separate agencies. In 2016, the same dataset totals 6,414. That is an increase of 2,627 executive positions, about 41 percent, in a decade.
So the obvious question is not whether Ottawa can announce a round number. The question is whether the Carney government will publish the ledger behind it. Which departments added executives? Which titles are being eliminated? Which positions are vacant, duplicated, temporary, reclassified or protected? Which executives receive performance pay, transition agreements, early-retirement treatment or severance? Which abolished jobs quietly return as consulting contracts?
Treasury Board’s binder admits a key cost is not known in advance. Asked how much executive career-transition measures will cost, the official answer says agreements are negotiated between executives and deputy heads, include cash and non-cash elements, and cannot be precisely predicted. That is exactly why the public needs ongoing disclosure. A cut that triggers opaque payouts, then reappears through contractor backfill, is not savings. It is a shell game with better stationery.
The same binder also acknowledges the system became top-heavy. It says the ratio of executives to employees has increased since 2018 and that reducing the executive workforce should help speed decision-making, flatten organizations and align responsibilities with pay. That is a serious admission. If Ottawa already knows leadership bloat slowed government down, taxpayers deserve to know who approved the growth, what it cost, and why it took a budget squeeze to reverse it.
Treasury Board’s June 30 quarterly financial report shows the cuts are not abstract. It attributes a year-to-date personnel-expenditure change in part to full-time-equivalent reductions from Comprehensive Expenditure Review workforce adjustments, attrition and transfers, with some positions expected to be replaced. “Some positions expected to be replaced” is doing a lot of work. Replaced by whom, at what cost, and under what classification?
A conservative accountability standard is simple: publish the payroll ledger before booking political credit. Canadians should see executive headcount by department and year, total salary bands, performance pay, bonuses, acting appointments, severance, transition agreements, vacancies, positions eliminated, positions recreated, consultant backfill, service impacts and actual savings.
If the government really cut bureaucracy, the ledger will prove it. If it merely trimmed visible titles while preserving the cost, the ledger will prove that too. Either way, taxpayers paid for the bureaucracy. They are entitled to the receipts.
- Treasury Board of Canada Secretariat: President of the Treasury Board appearance at OGGO — Supplementary Estimates (C) 2025–26
- Open Government Canada: Federal public service executive and non-executive statistics
- Treasury Board of Canada Secretariat: Quarterly Financial Report for the Quarter Ended June 30, 2026
- Blacklock’s Reporter: September 2026 archive
This article relies on official Treasury Board and Open Government records for the numerical headcount and reduction claims, and treats Blacklock’s as an independent lead rather than the sole factual basis.